Health and Safety Perception Survey
By Laurel Woodhouse, Manager, Health and Safety
ASP Employees! Our final participation rate for the 2022 Health & Safety Perception Survey was 40%. We thank you for both your participation and your honesty. Your feedback is an invaluable tool for this organization’s success.
Thank you to all those employees who participated in our 2022 ASP Health & Safety Perception Survey which closed on March 30, 2022.
What’s Next?
1. Results Overview:
Within the next month, our leadership will be following up with their employees and sharing their department specific results.
2. Detailed Results:
Within the next two months, our leadership team will create focus groups made up of employees from each department. The goal of these focus groups will be to brainstorm an action plan focused on improving the two lowest scores in each department. We hope to see these areas improve when we conduct this survey again in 2023.
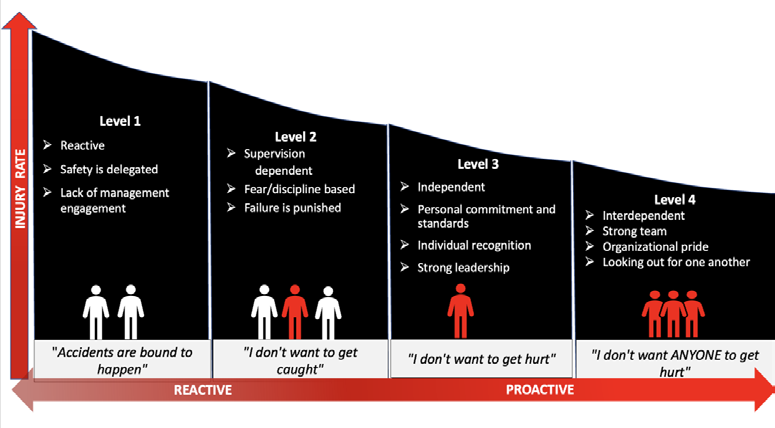
| Interpreting your score | Checking your score below along with the suggestions for next steps. The levels in the visual above will guide you in interpreting your final score on a 0 4 scale. |
| Level 1 | Final score is less than 2. Your work in health & safety needs attention and improvement. Contact H&S team for guidance on developing an action plan. |
| Level 2 | Final score is less than 3. Specific health and safety practices at your site need some improvement. The lower scored items should be a focus area for you. Review your practices and consult with H&S team for guidance in developing an action plan. |
| Level 3 | Final score is equal to or greater than 3 but less than 4. You are performing well overall. The lower scored items should be a focus area for you. Continue to strive for excellence with continuous collaboration work. |
| Level 4 | Final score is 4. A score of 4 indicates that your safety culture is currently functioning at an optimal level. This is the result of continuous, collaborative work. Well done keep doing what you are doing. |
Thanks again for your participation! Your feedback will help make our organization a great place to work.
Safety Culture Assessment Survey Results
The table below shows a detailed report of your Safety Assessment Survey results.
The percentage column indicates the percentage of employees who chose “ Most or all of the time” as their answer.
| At my site, employees work safely even when the manager or supervisor is not around? | 87% |
| At my site, incident investigations are focused on fixing the problem, not laying blame? | 80% |
| At my site, safety is as important as the clients’ needs? | 86% |
| At my site, do all employees have the information needed to work safely? | 84% |
| At my site, the ASP employees responsible for safety (managers and supervisors) have the authority to make changes they deem necessary? | 77% |
| At my site, ASP employees are recognized for working safely? | 75% |
| At my site, do all ASP employees have the tools/equipment to work safely? | 77% |
| At my site, ASP management is visibly/actively involved in the safety? | 71% |
| At my site, communication is open, and ASP employees are encouraged to voice concerns and make suggestions? | 72% |
| At my site, there is a trained first aid attendant available at all times? | 56% |
| At my site, ASP employees are encouraged to report near misses (close calls) and hazards? | 81% |
| At my site, ASP management applies the same safety rules to everyone? | 86% |
| Average score March 2022 | 78% |